WHY: You run two experiments recording the same neurons — but the second session used louder sounds, so ALL firing rates are 3× higher. The pattern (which neurons fire more) is identical. The intensity is different. To compare patterns, you remove the magnitude.
That's normalization: divide every component by the vector's length. The result is a unit vector — same direction, length = exactly 1.
Key insight from NMA: Normalizing does NOT change direction. The arrow still points the same way — it just gets shrunk to length 1.
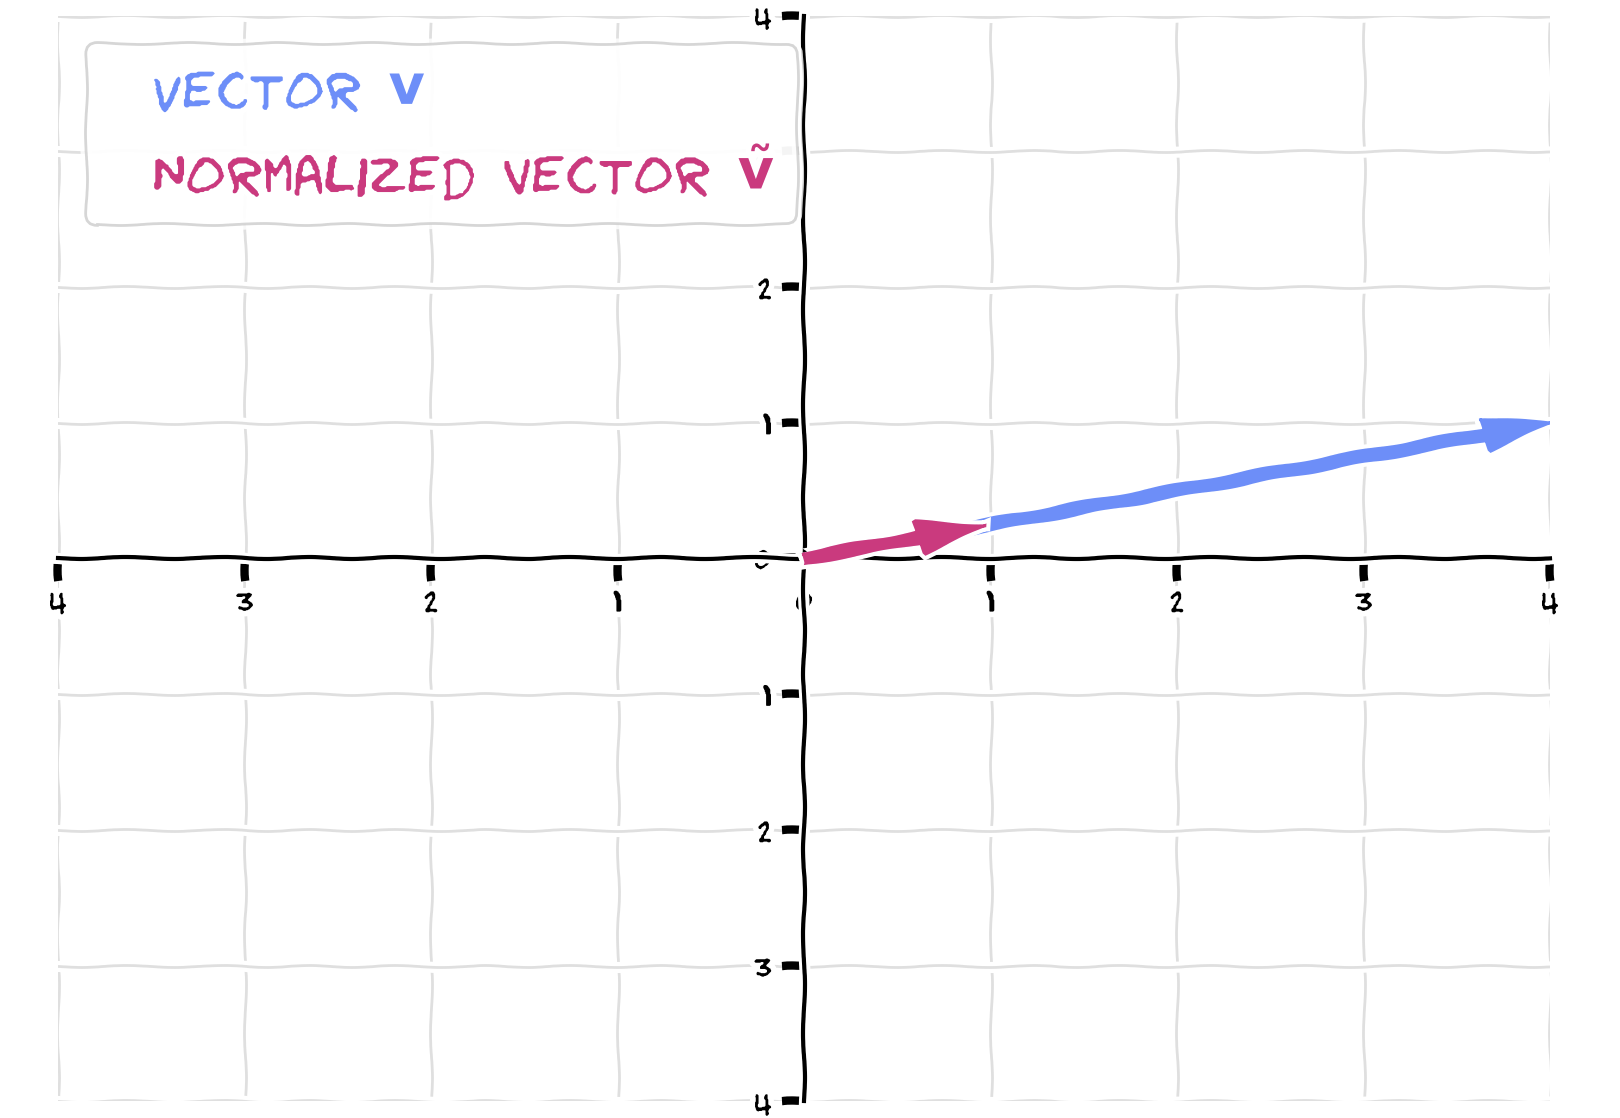
Before and after normalization: same direction, length becomes 1.
x̂ = x / ‖x‖
Divide each component by the length → unit vector with length 1.
x̂ is pronounced 'x-hat'. The hat symbol means 'unit vector'.
import numpy as np

v = np.array([3, 4])           # length = 5
v_unit = v / np.linalg.norm(v) # normalize

print(v_unit)                  # [0.6, 0.8]
print(np.linalg.norm(v_unit))  # 1.0 — always 1 after normalization
After normalization, np.linalg.norm() always returns 1.0.
Want to see it? NMA uses a helper function called visualize_vectors to draw both arrows on the same plot. Here's the full definition — copy this whenever you want to visualize vectors:
import numpy as np
import matplotlib.pyplot as plt

def visualize_vectors(v, v_unit):
    """Plot the original vector and its unit vector as arrows."""
    fig, ax = plt.subplots(figsize=(5, 5))

    # Original vector — blue
    ax.arrow(0, 0, v[0], v[1],
             head_width=0.15, head_length=0.15,
             fc='#1CB0F6', ec='#1CB0F6',
             length_includes_head=True,
             label=f'v  (length={np.linalg.norm(v):.2f})')

    # Unit vector — orange
    ax.arrow(0, 0, v_unit[0], v_unit[1],
             head_width=0.1, head_length=0.1,
             fc='#FF9600', ec='#FF9600',
             length_includes_head=True,
             label='v_unit  (length=1.0)')

    lim = np.linalg.norm(v) + 0.5
    ax.set_xlim(-lim, lim)
    ax.set_ylim(-lim, lim)
    ax.set_aspect('equal')
    ax.axhline(0, color='k', linewidth=0.5)
    ax.axvline(0, color='k', linewidth=0.5)
    ax.legend()
    ax.set_title('Original vector vs unit vector')
    ax.grid(True, alpha=0.3)
    plt.show()

# --- Try it ---
v = np.array([3, 4])
v_unit = v / np.linalg.norm(v)

with plt.xkcd():       # xkcd = hand-drawn style (NMA's aesthetic)
    visualize_vectors(v, v_unit)
plt.xkcd() gives the sketchy hand-drawn look NMA uses. The blue arrow is the original; the orange arrow is the unit vector — same direction, shorter.
Session A neurons: [10, 50, 2] (quiet lab)
Session B neurons: [30, 150, 6] (loud lab — 3× everything)
Both normalize to the same unit vector → you can now compare the pattern of activity, not the volume.